Dashboard Capabilities
Real analytics features for understanding the shop performance
Sales Velocity Tracking
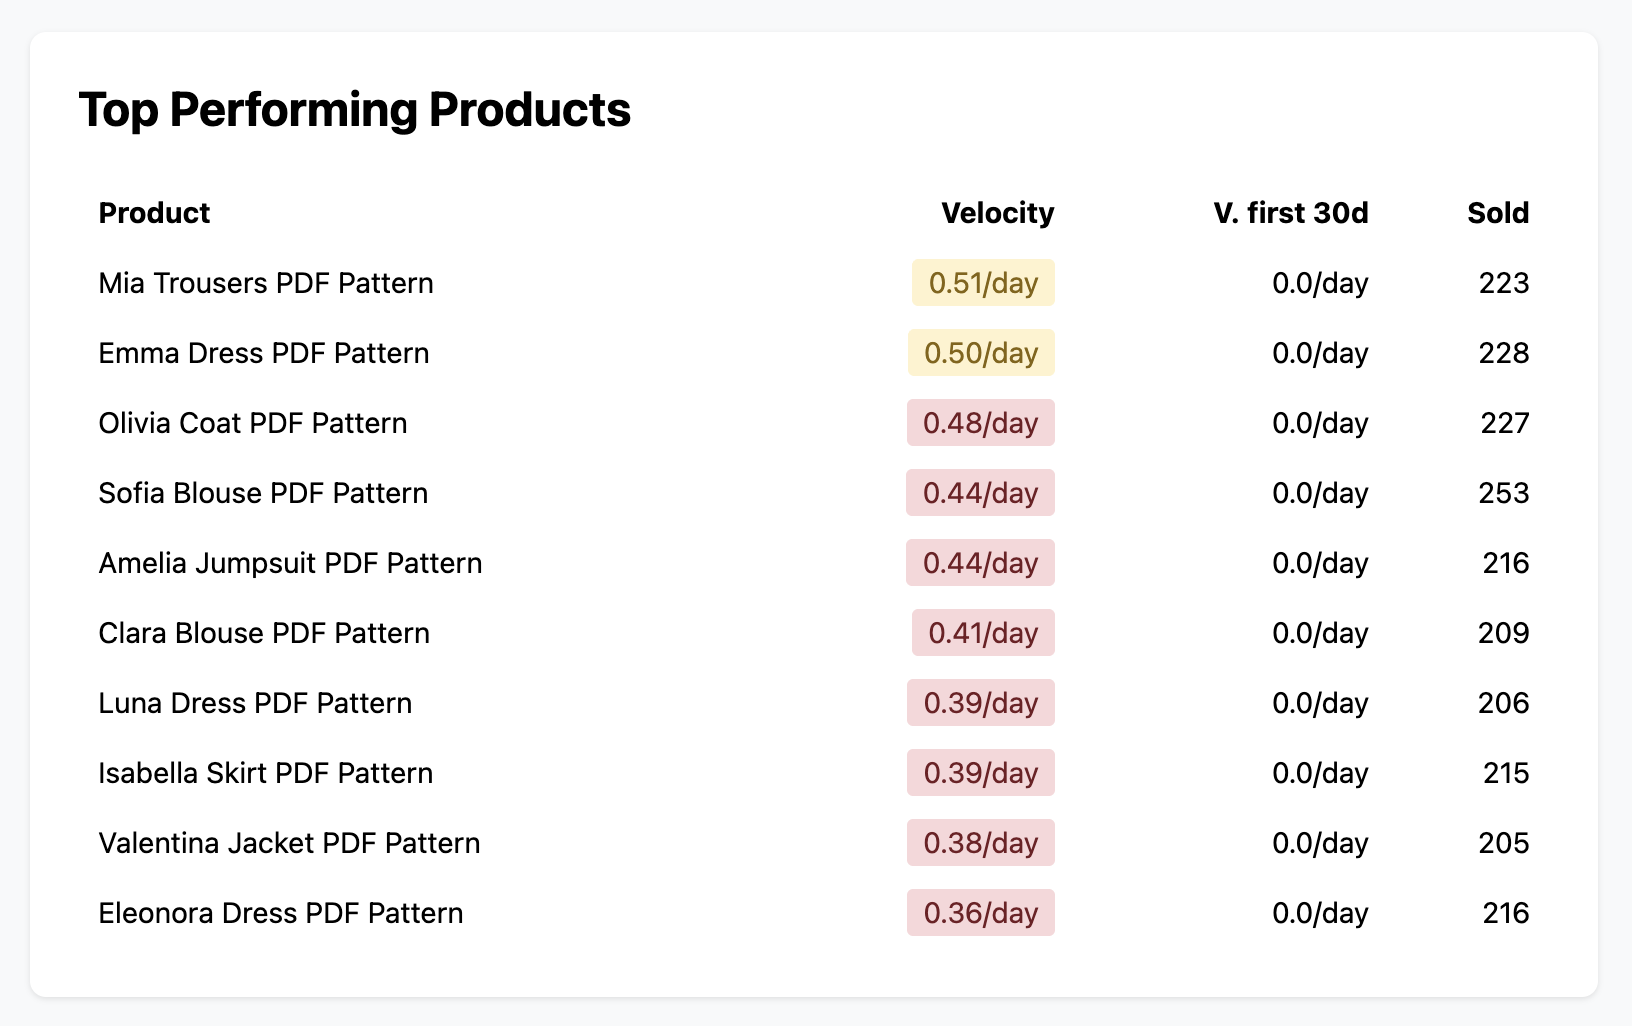
Monitor how quickly products sell from their launch date. Understand sales momentum for better inventory planning.
Metrics Shown:
- •Units sold per day/week since launch
- •Velocity trends over time
- •Product performance comparison
Revenue Analysis
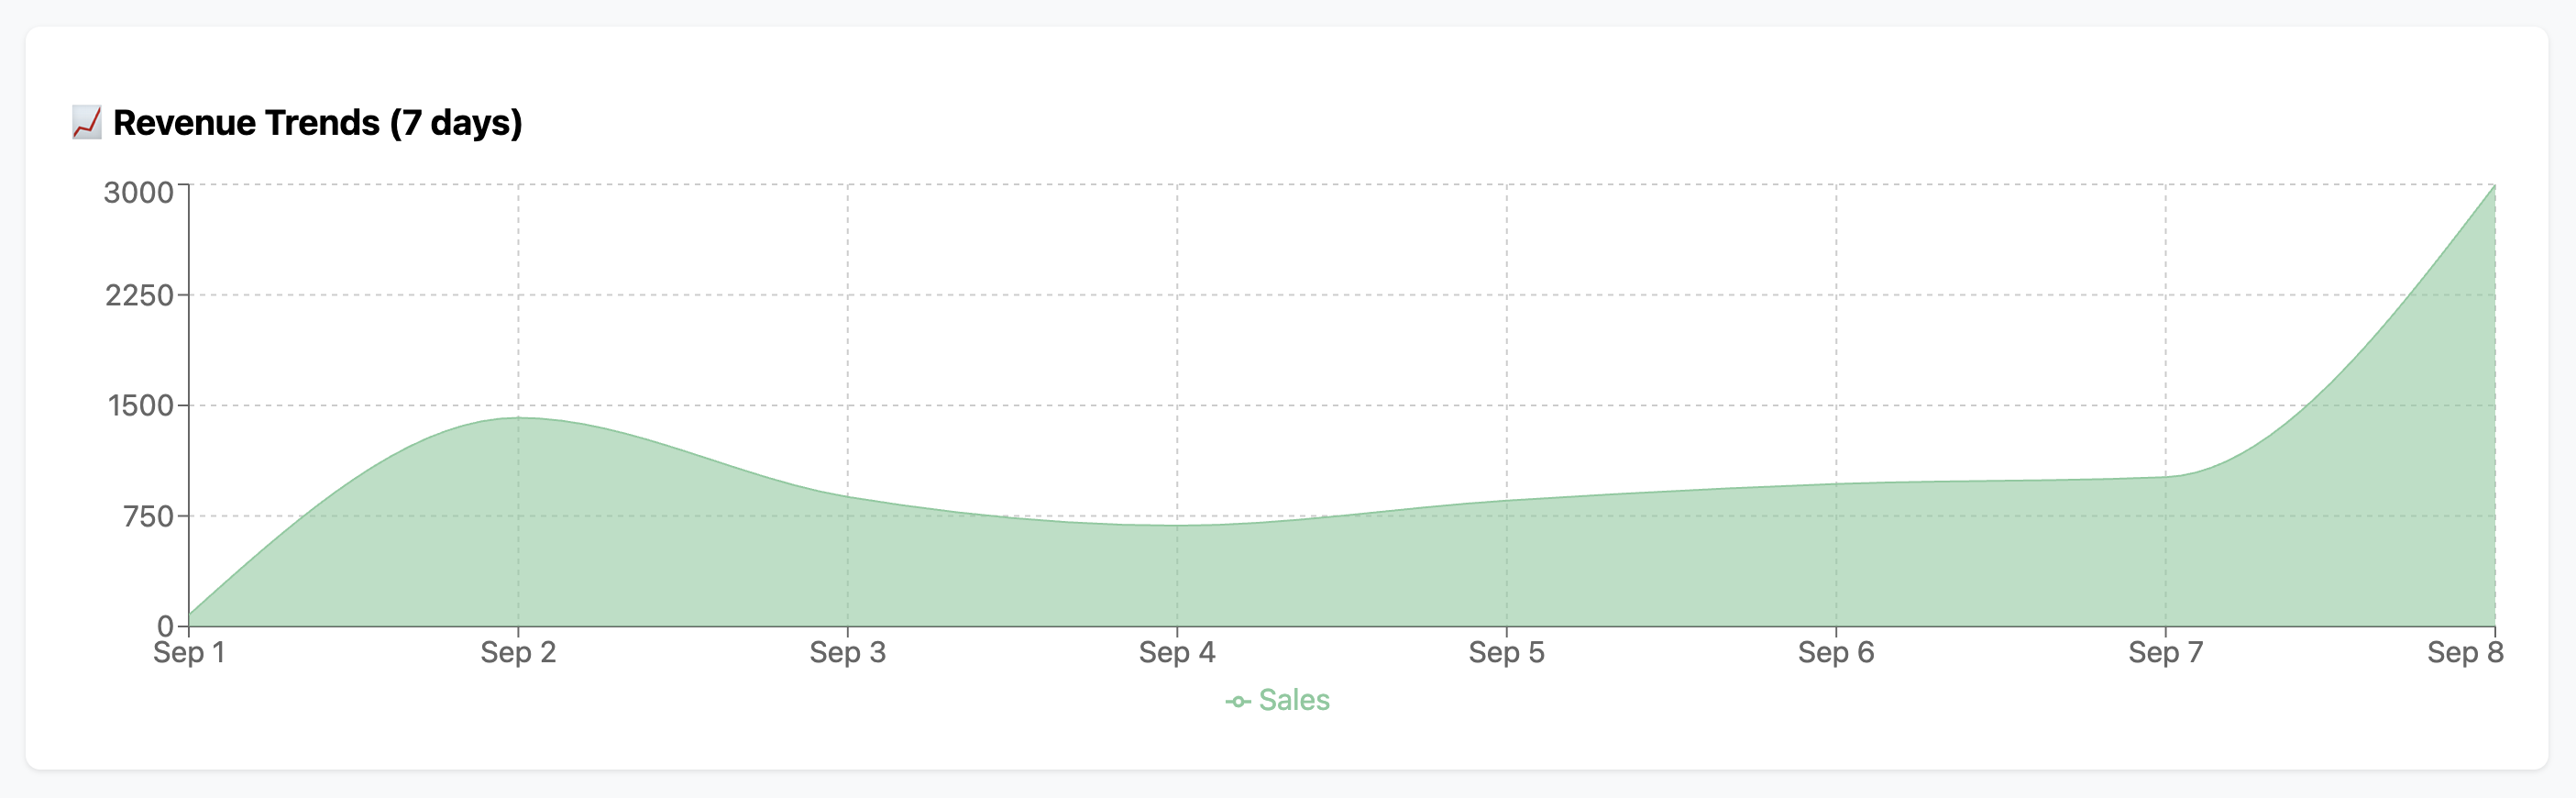
Track revenue performance over time with detailed breakdowns and historical comparisons.
Metrics Shown:
- •Monthly/weekly revenue
- •Year-over-year comparisons
- •Seasonal patterns
Top Products Dashboard
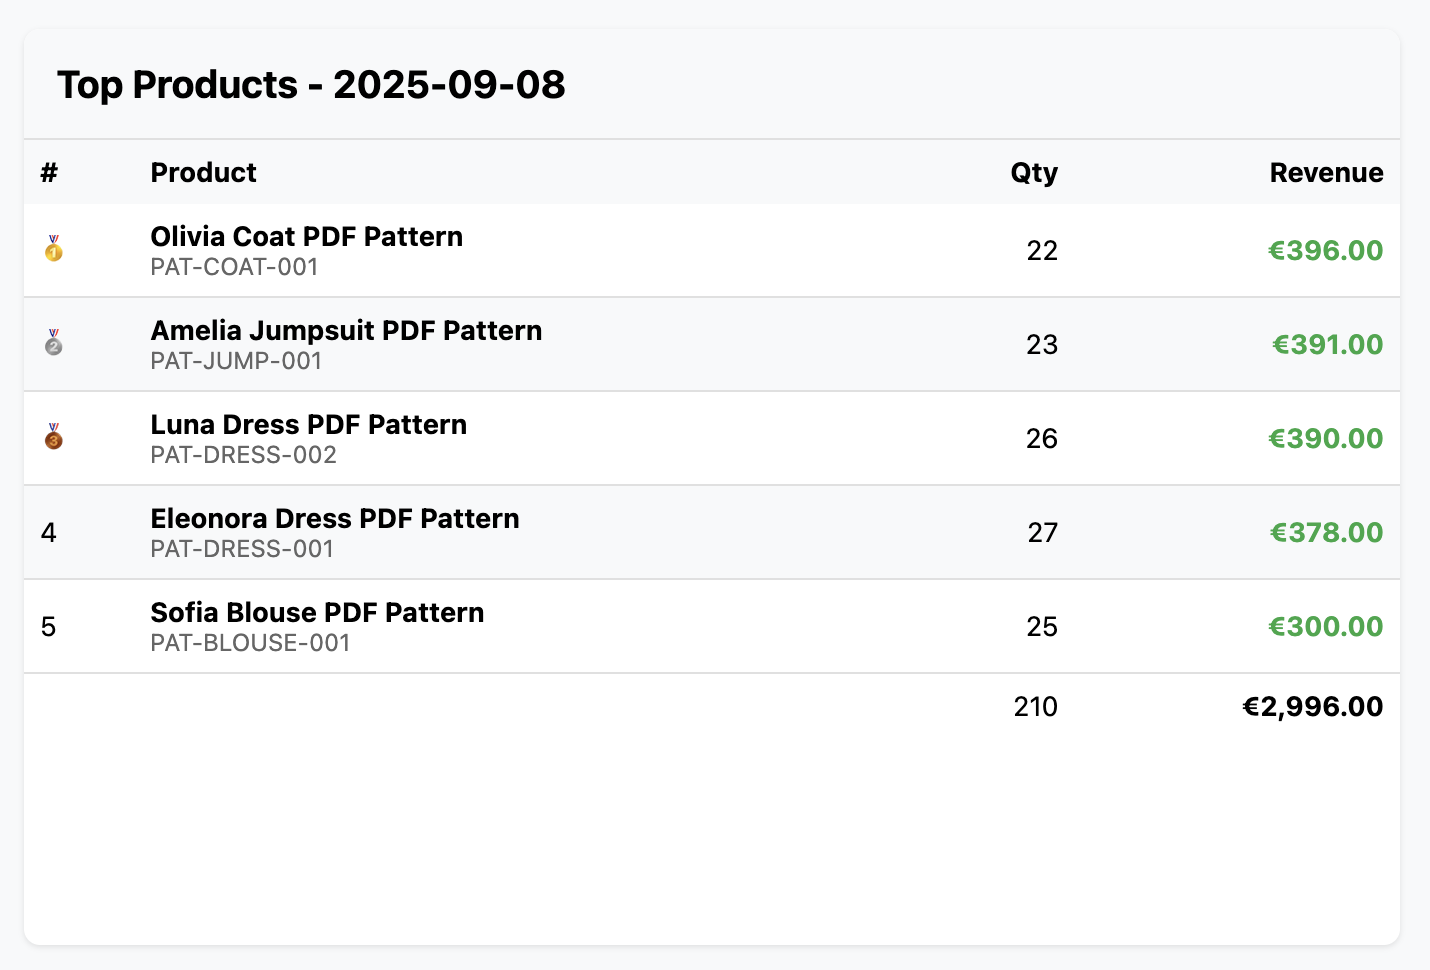
Quickly identify which products drive the most revenue and units sold.
Metrics Shown:
- •Total revenue per product
- •Units sold
- •Average order value
Historical Trends
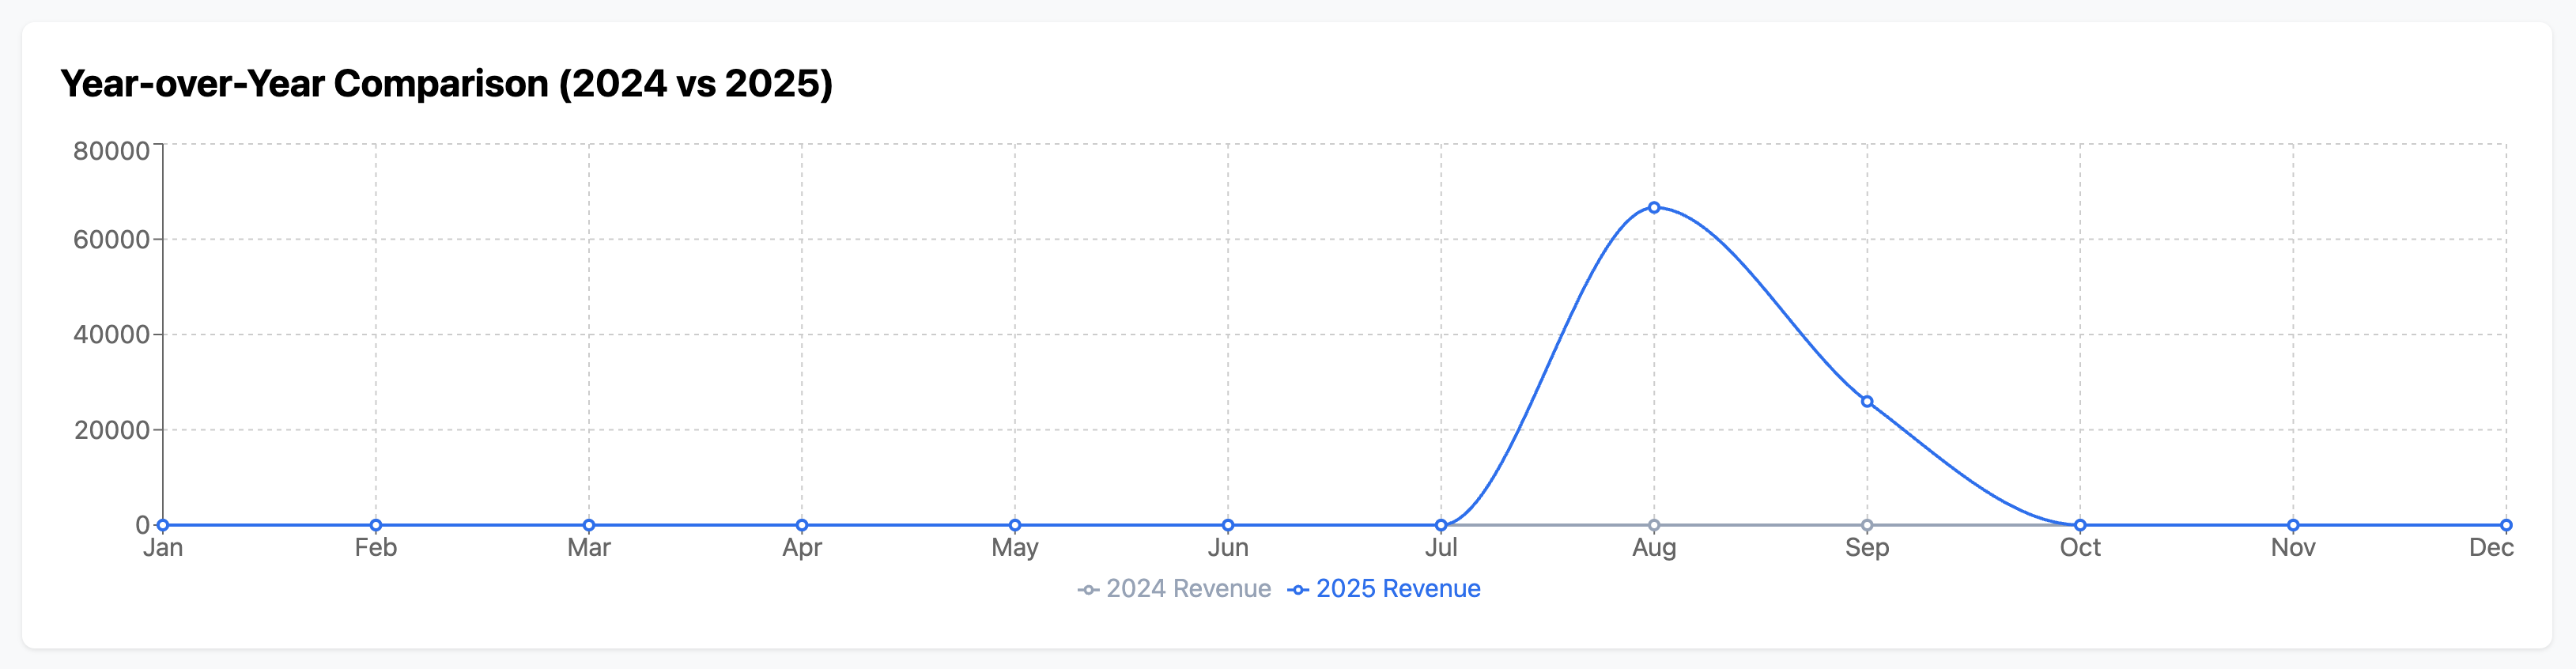
Access comprehensive historical data to understand long-term business trends.
Metrics Shown:
- •Sales trends over custom date ranges
- •Growth patterns
- •Performance metrics